Everything is good (though there's certain problems with matplotlib's triangulation sometimes) but in this case I had a hole in a flow field. So if I have a file with (x, y, value) tuples, the hole will be also triangulated with a value equal to zero and a final tricontourf figure will be quite far from the original flow field. Also as OpenFOAM's sample utility will anyway create a triangulation of the mesh, why do it again. So I've decided to try plotting VTK file with a triangular grid. And it was more or less easy. Though there's almost no documentation on python-vtk module. Well, I guess this module is just a wrapper around C++ so one need to write C++-python instead of python.
Surely this script can be improved to handle vectors and scalars automatically, to handle polymesh files in more general way (currently I suppose, all polygons in the mesh are triangles).
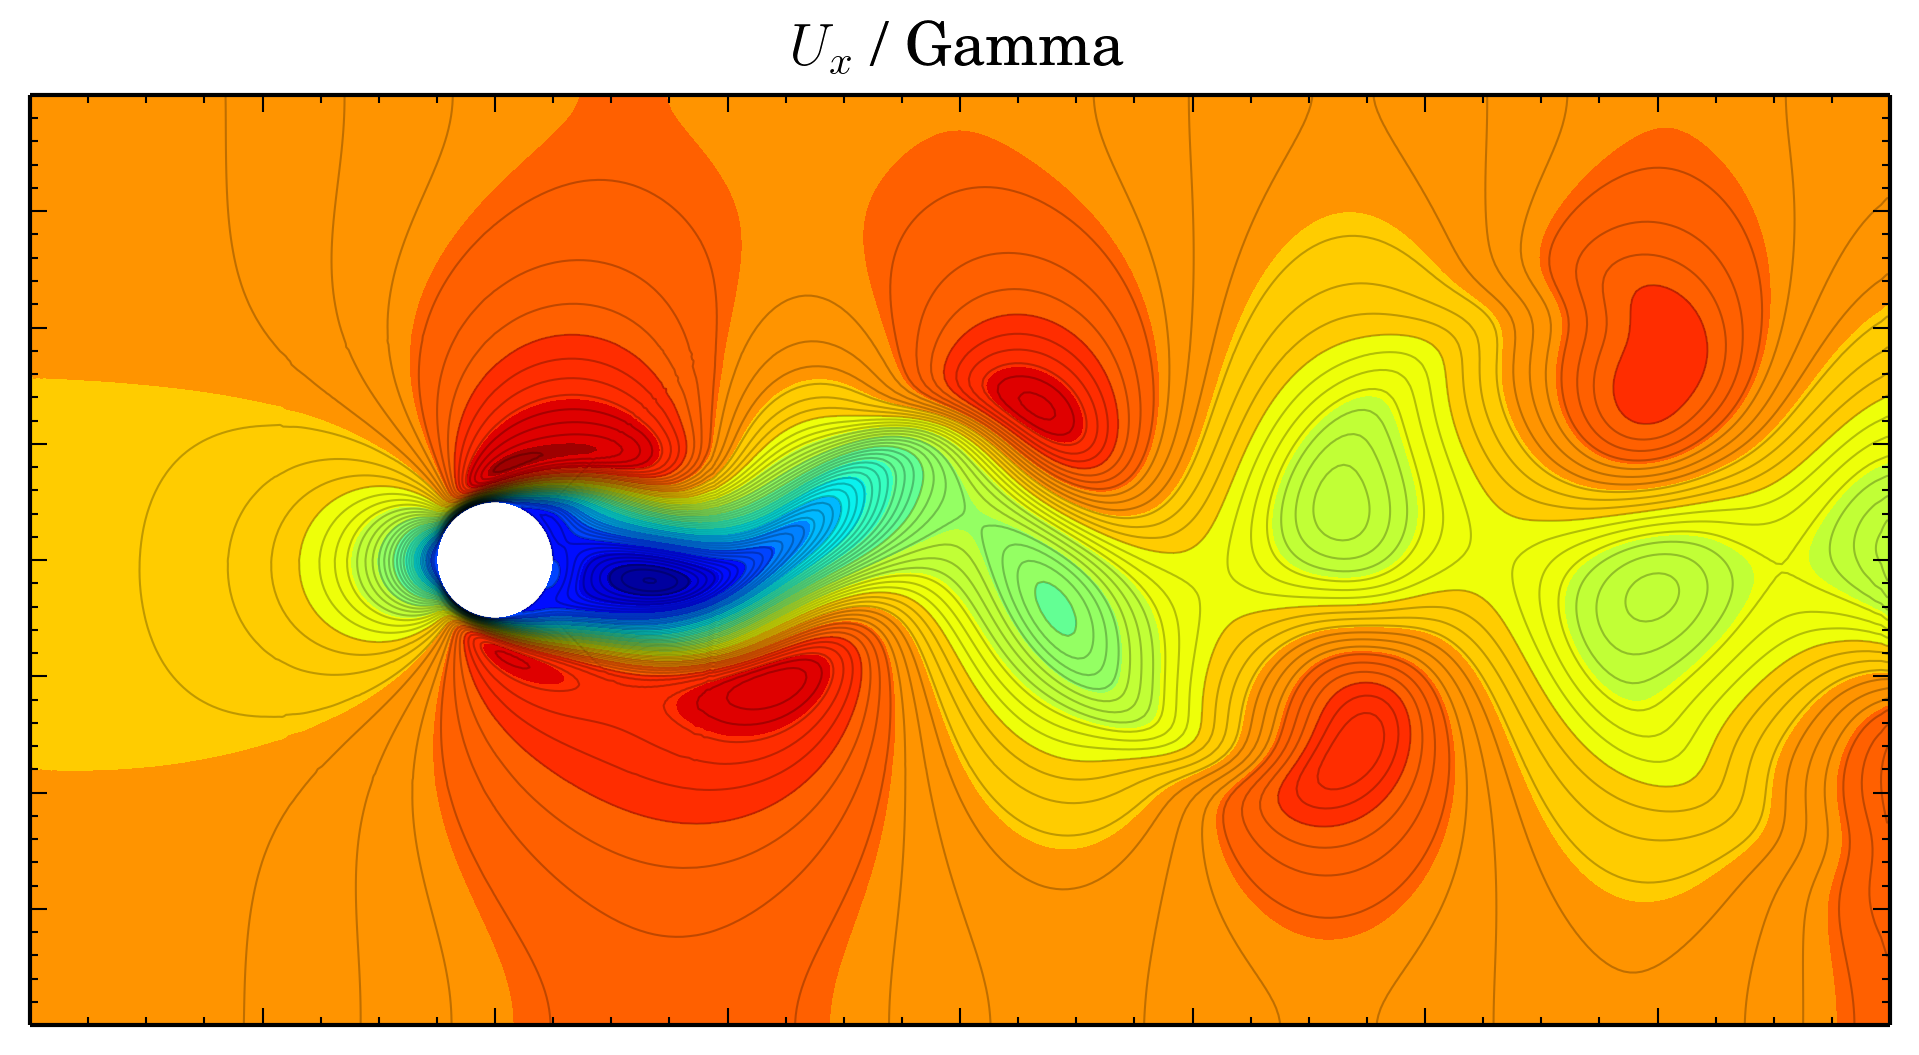
Here is a script for loading a vector field and plotting its X component:
#!/usr/bin/env python

import numpy as N
import vtk
import matplotlib.pyplot as P

def load_velocity(filename):
    if not os.path.exists(filename): return None
    reader = vtk.vtkPolyDataReader()
    reader.SetFileName(filename)
    reader.ReadAllVectorsOn()
    reader.Update()

    data = reader.GetOutput()
    cells = data.GetPolys()
    triangles = cells.GetData()
    points = data.GetPoints()
    point_data = data.GetPointData()
    Udata = point_data.GetArray(0)

    ntri = triangles.GetNumberOfTuples()/4
    npts = points.GetNumberOfPoints()
    nvls = Udata.GetNumberOfTuples()

    tri = N.zeros((ntri, 3))
    x = N.zeros(npts)
    y = N.zeros(npts)
    ux = N.zeros(nvls)
    uy = N.zeros(nvls)

    for i in xrange(0, ntri):
        tri[i, 0] = triangles.GetTuple(4*i + 1)[0]
        tri[i, 1] = triangles.GetTuple(4*i + 2)[0]
        tri[i, 2] = triangles.GetTuple(4*i + 3)[0]

    for i in xrange(points.GetNumberOfPoints()):
        pt = points.GetPoint(i)
        x[i] = pt[0]
        y[i] = pt[1]

    for i in xrange(0, Udata.GetNumberOfTuples()):
        U = Udata.GetTuple(i)
        ux[i] = U[0]
        uy[i] = U[1]

    return (x, y, tri, ux, uy)

P.clf()
levels = N.linspace(-0.5, 1.5, 64)
x, y, tri, ux, uy = load_velocity('U-file.vtk')
P.tricontour(x, y, tri, ux, levels, linestyles='-',
             colors='black', linewidths=0.5)
P.tricontour(x, y, tri, ux, levels)
P.gca().set_aspect('equal')
P.minorticks_on()
P.gca().set_xticklabels([])
P.gca().set_yticklabels([])
P.title('$U_x$ / Gamma')
P.savefig("Ux.png", dpi=300, bbox_inches='tight')
P.savefig("Ux.pdf", bbox_inches='tight')
(Note: updated version of the script adapted for VTK 6.2.0 is posted here)
And as a result of this script we'll get this nice picture:
And here is a link to the genereated PDF.
Great tips, thanks !
RépondreSupprimerI was wondering if such things was possible to avoid long paraview session.
Did you heard about FunkyPythonPostproc from swak4Foam:
https://github.com/Unofficial-Extend-Project-Mirror/openfoam-extend-Breeder1.7-libraries-swak4Foam/tree/master/Examples/FunkyPythonPostproc
It's supposed to simplify the post processing of foam data with python but I don't already tried it myself.
I'm currently looking for a way to extract volume data along a line or plane without using the OpenFOAM sample utility or Paraview within a Ipython session.
By the way I found your blog posts excellent.
Thanks :)
Thanks.
SupprimerActually I'm not trying to replace sample or Paraview, they are doing what they intended to do quite fine (also rewriting sample functionality would violate Unix-way ;)). In general I use Python and matplotlib for producing plots in vector format (PDF, EPS) and for batch processing/plotting of sampled data during comparative studies (and if there're lots of uniformly distributed probe points, like in meandering channel experiments, I use Python to generate sampleDict).
With Paraview 4.1 you can export in vector format with menu File > Export scene ...
RépondreSupprimerEnjoy :)
Thanks for suggestion.
SupprimerSurely there are certain nuances with exported PDF though it's not important.
Hello Alexey,
RépondreSupprimerWonderful tutorial, I really appreciate your help with OpenFOAM! This script you posted here seems to be exactly what I am looking for, but I am running into a small problem.
I am having trouble using your script with an OpenFOAM-created sample file in vtk format (using the sample utililty). I adapted your script for my case, but now I run into an error about the term Udata. Specifically, on line 24 of your script, you write
nvls = Udata.GetNumberOfTuples()
At which point, my python script ends with the error:
AttributeError: 'NoneType' object has no attribute 'GetNumberOfTuples'
It looks like the line where you define Udata, , is no longer valid in the current version of python and vtk (python 2.7.8, vtk 6.2.0). You mention the lack of documentation, which I can confirm after looking around today. Do you have an idea of what may be the issue here?
Hello,
SupprimerIt seems in earlier versions VTK created point data automatically, in version 6.2.0 it not, so data.GetPointData() returns empty object and finally point_data.GetArray(0) return None.
To solve the problem one can use vtk.vtkCellDataToPointData object. You can find updated version of the script at https://gist.github.com/mrklein/44a392a01fa3e0181972. Main difference is the addition of this piece of code:
mapper = vtk.vtkCellDataToPointData()
mapper.AddInputData(data)
mapper.Update()
mapped_data = mapper.GetOutput()
to create point data.
Howdy Alexey,
SupprimerThanks for responding to this thread after so long. After playing around I was able to deduce that the data was cell data, but I was unaware that you could convert that to point data. Your updated script solved my problem - your response was exactly what I needed.
NOTE: For my own reference later on and maybe for others in the future, your script worked as expected using an OpenFOAM 'plane' sample surface, but did not work when using another sample surface called 'cuttingPlane'. Specifically, there were some random black line artifacts that were created along mesh lines. I'm not sure exactly why this occurred, but that seemed to be an issue I ran into. Changing to a 'plane' sample surface removed this issue.
Cheers!
C
Example case with artifacts would be great.
SupprimerI have tested cuttingPlane behavior on cavity tutorial and everything seems to be OK (i.e. no difference in plots compared with plane sampling). But mesh in cavity tutorial is VERY simple, so maybe with more complex meshes there could be certain problems.
Hi Alexey,
RépondreSupprimerThank you for the great tutorial. Im wondering if you had ever encountered the following problem i have with analysing vtk files generated by using foamToVTK. Everything you have done above works for me but I can't do
cells = data.GetPolys()
because I get an attribute error - this method doesn't seem to exist for me. Any ideas? Im also wondering if you would know a way to extract data along a normal from a surface, as one would do if trying to plot the boundary layer profile on a flat plate for instance.
Kind regards,
Oscar
I should mention that I do
Supprimerreader = vtk.vtkUnstructuredGridReader()
as my grid is a combination of structured and unstructured...Perhaps this is the root of the problem.
Hi Oscar,
Supprimerdata object that you get from data = reader.GetOutput() does not have GetPolys method if reader is vtkUnstructuredGridReader. Yet it has GetCells, GetCellData, GetPoints, GetPointData.
Thanks for your response. Basically I am trying to plot the mesh that I have computed my simulations on. I set the reader automatically by doing
Supprimerreader = OpenDataFile("mysimulation.case")
This gives the EnsightReader. Then unpack like so:
data=servermanager.Fetch(reader) # vtkMultiBlockDataSet
block0 = data.GetBlock(0) # vtkUnstructuredGrid
and I can plot the points of my mesh by doing
points = block0.GetPoints()
a_point = points.GetPoint(i)
and plotting these points. The problem is I want to plot field variables like pressure, and then I need to know the mesh connectivity information. With paraview its really easy to display the mesh and plot contourf plots of a field variable over it. So surely I should be able to do this with python. Creating the triangulation array as you have done above doesnt quite work for me; I do a
plt.triplot(x,y,triangles, 'bo-')
but the resulting mesh is a mess and does not show my actual mesh. Any ideas what I could do with this? There must be some data contained in the vtkUnstructuredGrid object that tells me the mesh connectivity info.
Thanks!
Actually I am now able to for each cell get the coordinates of each vertex of that cell. But I still can't figure out how to get triangulation information from these objects.
SupprimerHi,
SupprimerUnfortunately I do not quite understand what you are trying to do. You did not mention what kind of mesh you have, and I do not have anything that can be read with vtkEnSightReader. So here is an example (you need these two links: https://gist.github.com/mrklein/dc19fbac73564dabdba2 and https://github.com/mrklein/vtk-plot):
1. I have hybrid mesh created in Gmsh - inner hexagonal and outer prismatic.
2. I import it in OpenFOAM, run case, and then use foamToVTK to export data into VTK (so vtk-plot_0.vtk is data set of UNSTRUCTURED_GRID type)
3. I read it using vtkUnstructuredGridReader
4. I create a center-plane slice, so data = cutter.GetOutput() is 2D properly triangulated vtkPolyData.
5. I use old script to extract triangulation, points, and data.
Hi Alexey,
SupprimerThank you very much for your effort and time. Your example was great - I was able to figure out what was different between my case and yours (however curiously your potentialFoam example only runs for one time step and when I do foamToVTK the resulting files cannot be read in your example script which is strange - I only mention it in case someone attempts to use it!)
Basically what I was doing before was opening the file my 'case.foam' (this is the file that is created when you do paraFoam in the case folder) by
from paraview.simple import *
reader = OpenDataFile('my case.foam') #Creates OpenFoamReader object
finalTime = reader.TimestepValues[-1]
reader.UpdatePipeline(time=finalTime)
data = servermanager.Fetch(reader) #Creates a vtkMultiBlockDataSet
In the end I was able to achieve the same things whether I use the vtkUnstructuredGridReader or the automatic one. The only thing I am trying to figure out now is how to get a smooth interpolation of a scalar field over the triangulation without having to specify a ridiculous number of levels in tricontourf as this gives me crazy big pdf files and takes a long time to create. Any experience with this?
Once again I am very grateful for your help!
Hi Oscar,
SupprimerWell, potentialFoam in example was supposed to run just for one time step. It was used just to initialize flow.
Example in gist was really a little bit messed up, as IPython remembers all imports and in the session where I have written the example numpy was imported as np. The error was in np.zeros calls (instead of just zeros) during creation of certain arrays. Anyway, now the script is corrected (and tested with VTK 6.2.0).
To smooth data, you can use vtkLoopSubdivisionFilter. See example at http://www.vtk.org/Wiki/VTK/Examples/Python/PolyData/SubdivisionFilters.
Ce commentaire a été supprimé par l'auteur.
RépondreSupprimerHey Alexey,
RépondreSupprimerI have VTK 6.0 on and I got same error message for both cavity and void examples.
nvls = Udata.GetNumberOfTuples()
AttributeError: 'NoneType' object has no attribute 'GetNumberOfTuples'
I am very thankful for your help and your plots are so nice that I can't resist to have them.
Thank you
Shevchenko
Hi,
SupprimerWhat version of the script do you utilize? If the one posted here, then yes, there is a problem with VTK 6.x. Yet I have just checked script in the Gist (link is in the end of post - https://gist.github.com/mrklein/44a392a01fa3e0181972) and script at https://github.com/mrklein/vtk-plot, both work quite fine with VTK 7.
Hello Alexey,
RépondreSupprimerI was trying to adapt the code for a .vti file to plot the temperature just like the contours. I am assuming it would be more simple that the current case
The file is as below
https://www.dropbox.com/s/fd41qq3jsjhpn0n/Case-1.vti?dl=0
I was directly taking importing it to numpy arrays and I am not getting a satisfactory result
Hi,
SupprimerWe have to define meaning of "satisfactory result". For example, is this:
https://gist.github.com/mrklein/0829ce12808dcb63c9b00dc5c3782131
satisfactory or not?
Hi,
SupprimerThanks....I can have modified it for a better result. There was just one query....
you used data.GetPointData().GetArray(0) for the scalar array,
there is also a vector/component array(for velocity) in the .vti file
would you used data.GetPointData().GetArray(1).GetComponent(1,0) for the components or GetNumberOfTuples() method you have used in this blog for the elements in the component arrays?
Hi,
SupprimerUnfortunately, I was not able to understand your question. If it is "How I would read vector values from VTK file?", then you can look at https://github.com/mrklein/vtk-plot/blob/master/plot-vtk.py, to see, how I did it.
Ce commentaire a été supprimé par l'auteur.
RépondreSupprimer