Everything is good (though there's certain problems with matplotlib's triangulation sometimes) but in this case I had a hole in a flow field. So if I have a file with (x, y, value) tuples, the hole will be also triangulated with a value equal to zero and a final tricontourf figure will be quite far from the original flow field. Also as OpenFOAM's sample utility will anyway create a triangulation of the mesh, why do it again. So I've decided to try plotting VTK file with a triangular grid. And it was more or less easy. Though there's almost no documentation on python-vtk module. Well, I guess this module is just a wrapper around C++ so one need to write C++-python instead of python.
Surely this script can be improved to handle vectors and scalars automatically, to handle polymesh files in more general way (currently I suppose, all polygons in the mesh are triangles).
Here is a script for loading a vector field and plotting its X component:
#!/usr/bin/env python

import numpy as N
import vtk
import matplotlib.pyplot as P

def load_velocity(filename):
    if not os.path.exists(filename): return None
    reader = vtk.vtkPolyDataReader()
    reader.SetFileName(filename)
    reader.ReadAllVectorsOn()
    reader.Update()

    data = reader.GetOutput()
    cells = data.GetPolys()
    triangles = cells.GetData()
    points = data.GetPoints()
    point_data = data.GetPointData()
    Udata = point_data.GetArray(0)

    ntri = triangles.GetNumberOfTuples()/4
    npts = points.GetNumberOfPoints()
    nvls = Udata.GetNumberOfTuples()

    tri = N.zeros((ntri, 3))
    x = N.zeros(npts)
    y = N.zeros(npts)
    ux = N.zeros(nvls)
    uy = N.zeros(nvls)

    for i in xrange(0, ntri):
        tri[i, 0] = triangles.GetTuple(4*i + 1)[0]
        tri[i, 1] = triangles.GetTuple(4*i + 2)[0]
        tri[i, 2] = triangles.GetTuple(4*i + 3)[0]

    for i in xrange(points.GetNumberOfPoints()):
        pt = points.GetPoint(i)
        x[i] = pt[0]
        y[i] = pt[1]

    for i in xrange(0, Udata.GetNumberOfTuples()):
        U = Udata.GetTuple(i)
        ux[i] = U[0]
        uy[i] = U[1]

    return (x, y, tri, ux, uy)

P.clf()
levels = N.linspace(-0.5, 1.5, 64)
x, y, tri, ux, uy = load_velocity('U-file.vtk')
P.tricontour(x, y, tri, ux, levels, linestyles='-',
             colors='black', linewidths=0.5)
P.tricontour(x, y, tri, ux, levels)
P.gca().set_aspect('equal')
P.minorticks_on()
P.gca().set_xticklabels([])
P.gca().set_yticklabels([])
P.title('$U_x$ / Gamma')
P.savefig("Ux.png", dpi=300, bbox_inches='tight')
P.savefig("Ux.pdf", bbox_inches='tight')
(Note: updated version of the script adapted for VTK 6.2.0 is posted here)
And as a result of this script we'll get this nice picture:
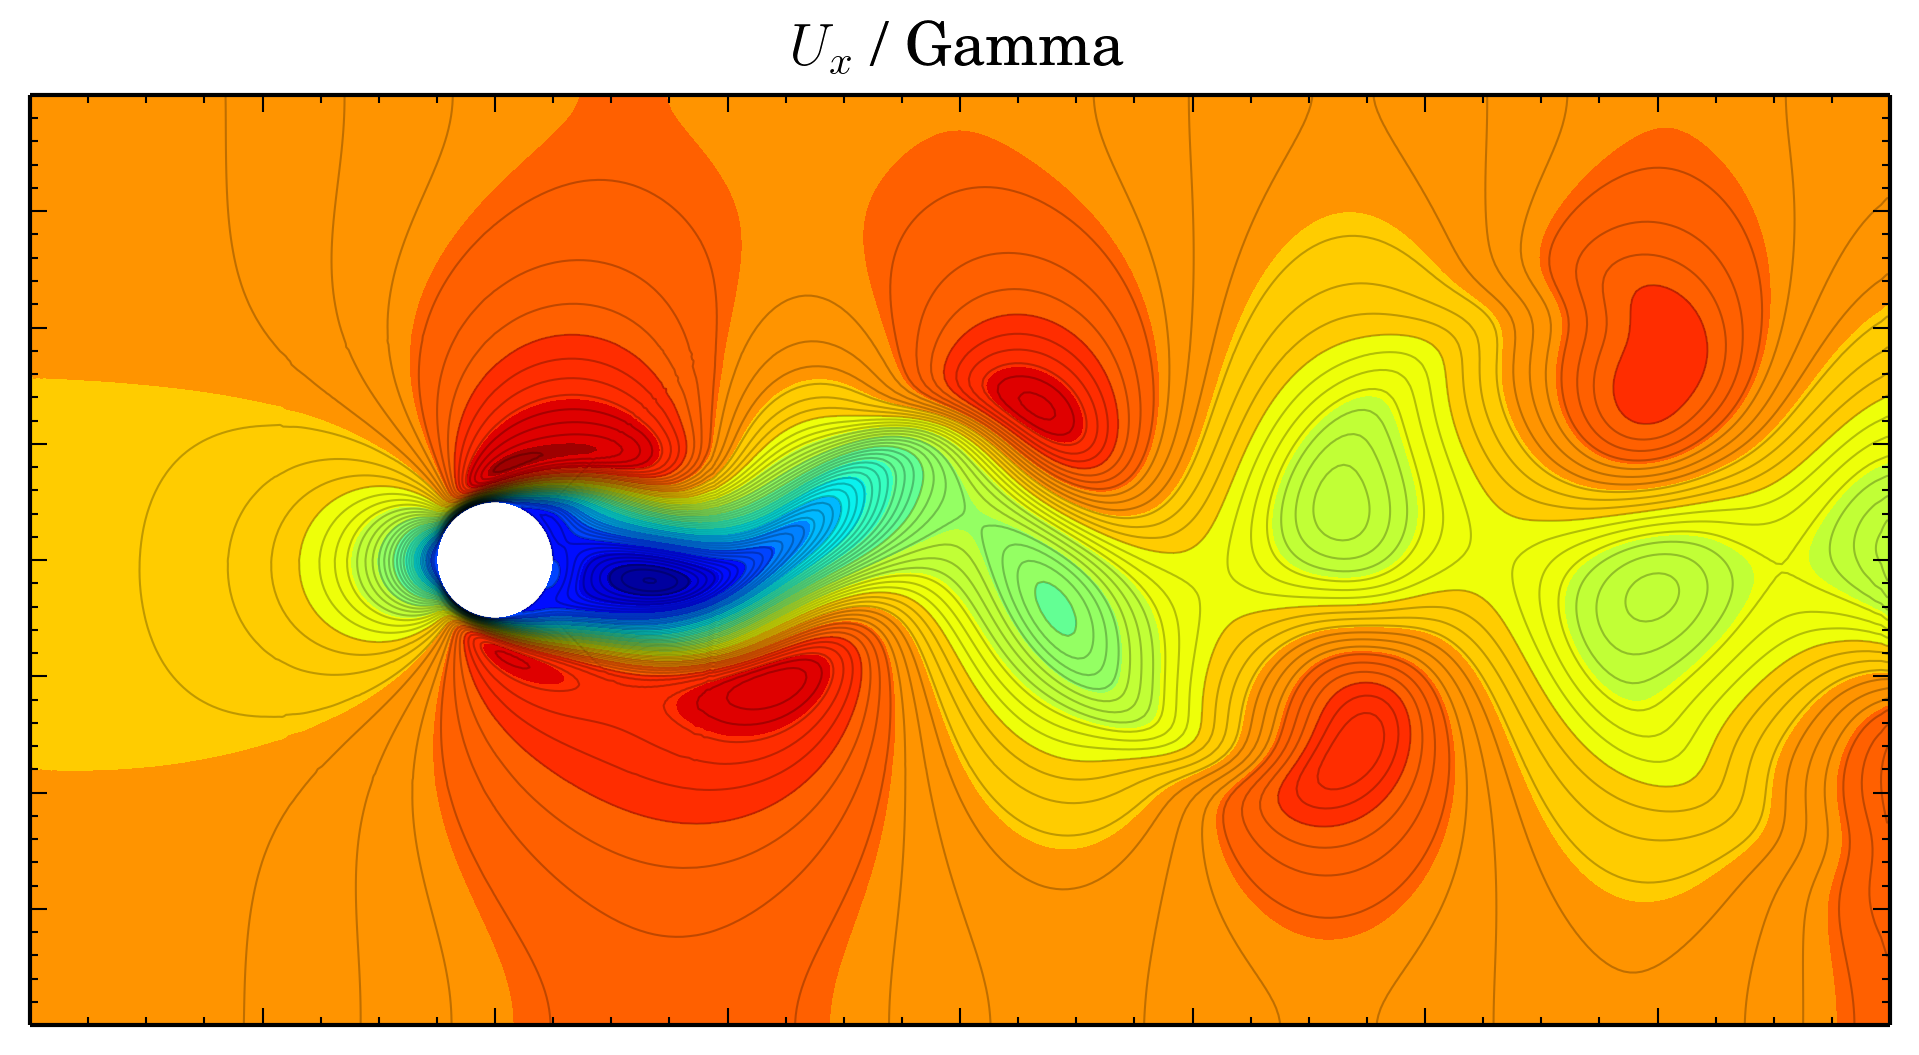
And here is a link to the genereated PDF.

